




Rail Traffic Signals a Weakening Economy Before the Headlines Catch Up
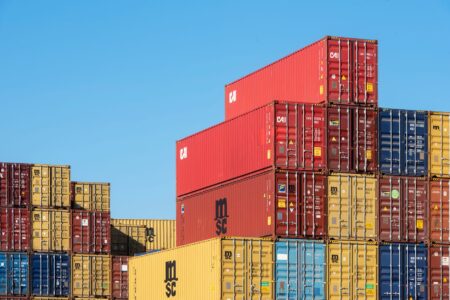
Freight rail volume has long served as one of the more honest economic indicators available – it moves actual physical goods, not survey sentiment or revised projections. When carload and intermodal shipments start declining in tandem, it tends to mean the real economy is cooling, not just the forecasts. That is exactly what the current rail traffic picture suggests, as volumes have slipped across multiple commodity categories over recent weeks, driven in large part by softening demand from the manufacturing sector.
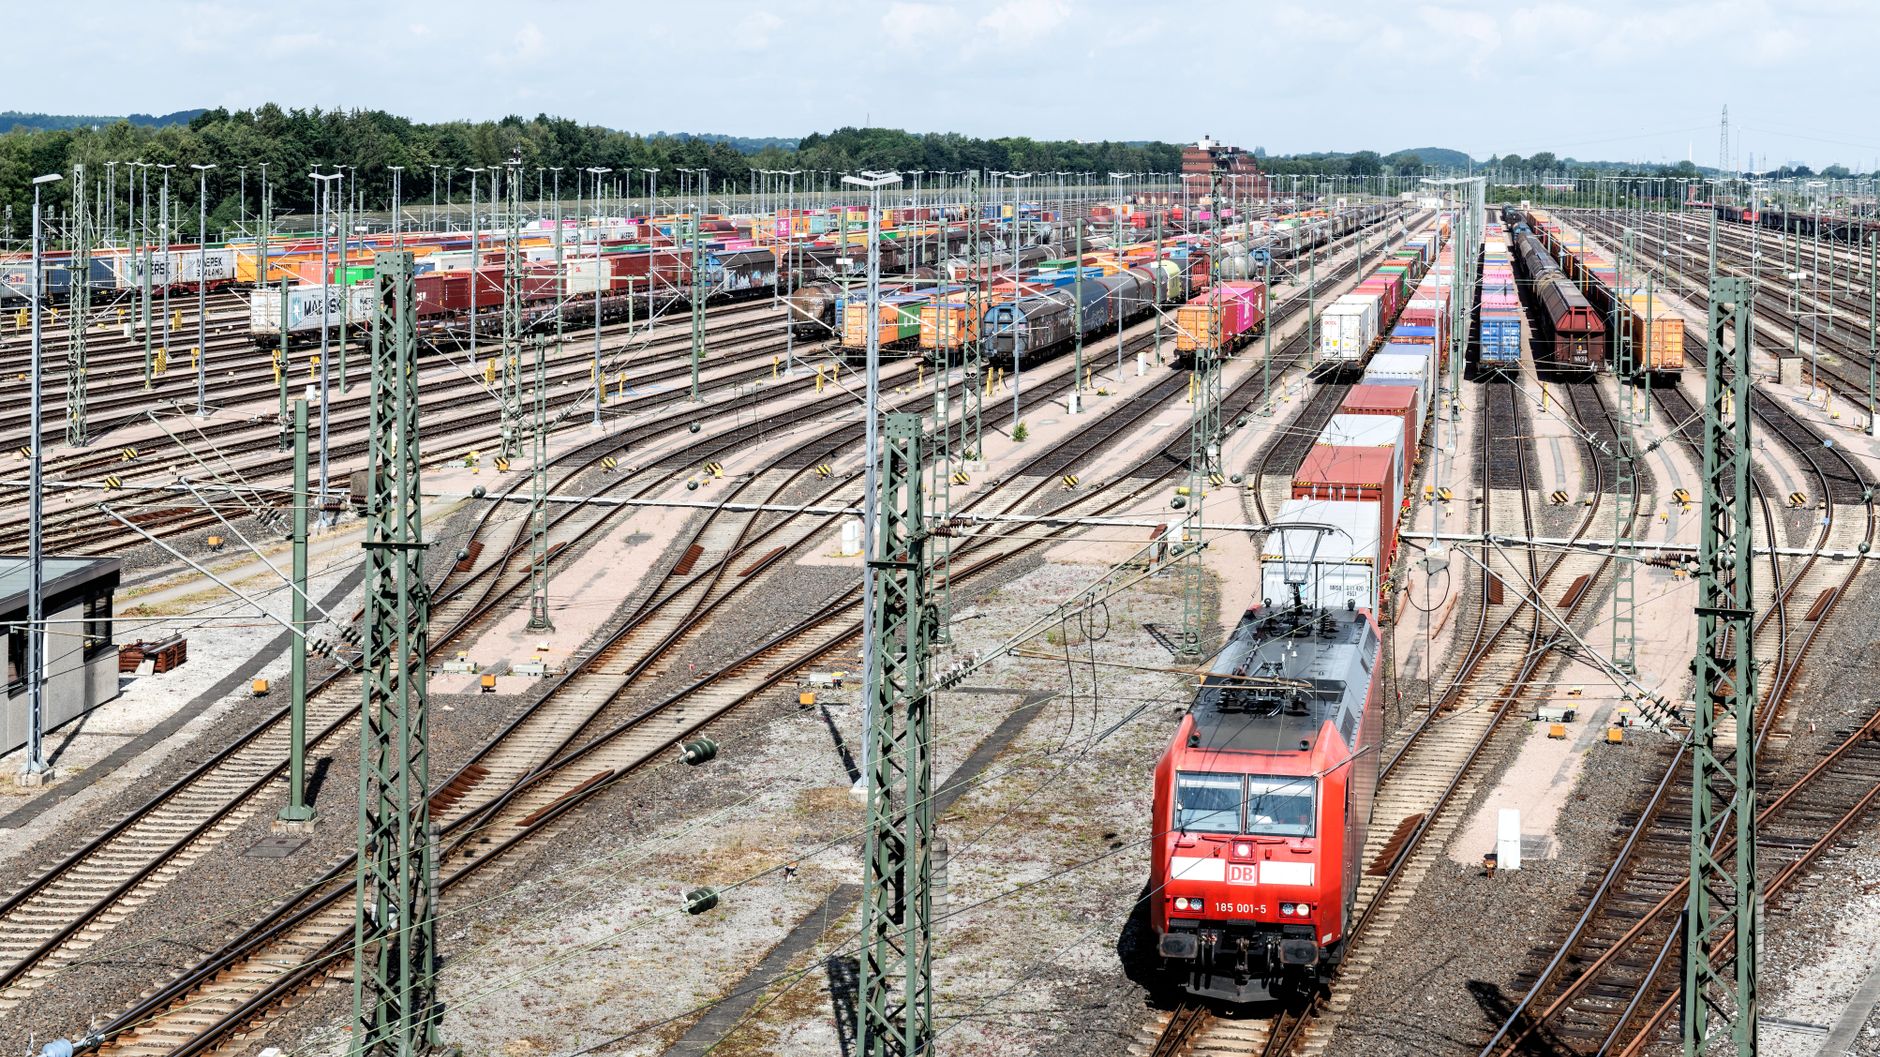
The slump is not a single-week blip. Rail traffic readings have shown persistent weakness in categories tied to industrial production: chemicals, metals and metal products, petroleum and petroleum products, and motor vehicles and parts. These are inputs and outputs of factories, not consumer discretionary goods. When manufacturers stop ordering raw materials and stop shipping finished products at the same pace, rail volumes follow. Right now, they are following downward.
Manufacturing Orders Are Doing the Damage
The connection between manufacturing order flow and rail volume is direct and relatively fast-moving. When a factory books fewer new orders, it draws down existing inventory rather than placing fresh supply orders. That means fewer raw material shipments inbound and fewer finished goods shipments outbound. The lag between an order slowdown and a visible rail volume drop is typically measured in weeks, not months, which makes freight traffic one of the sharper leading indicators available without waiting for official government data releases.
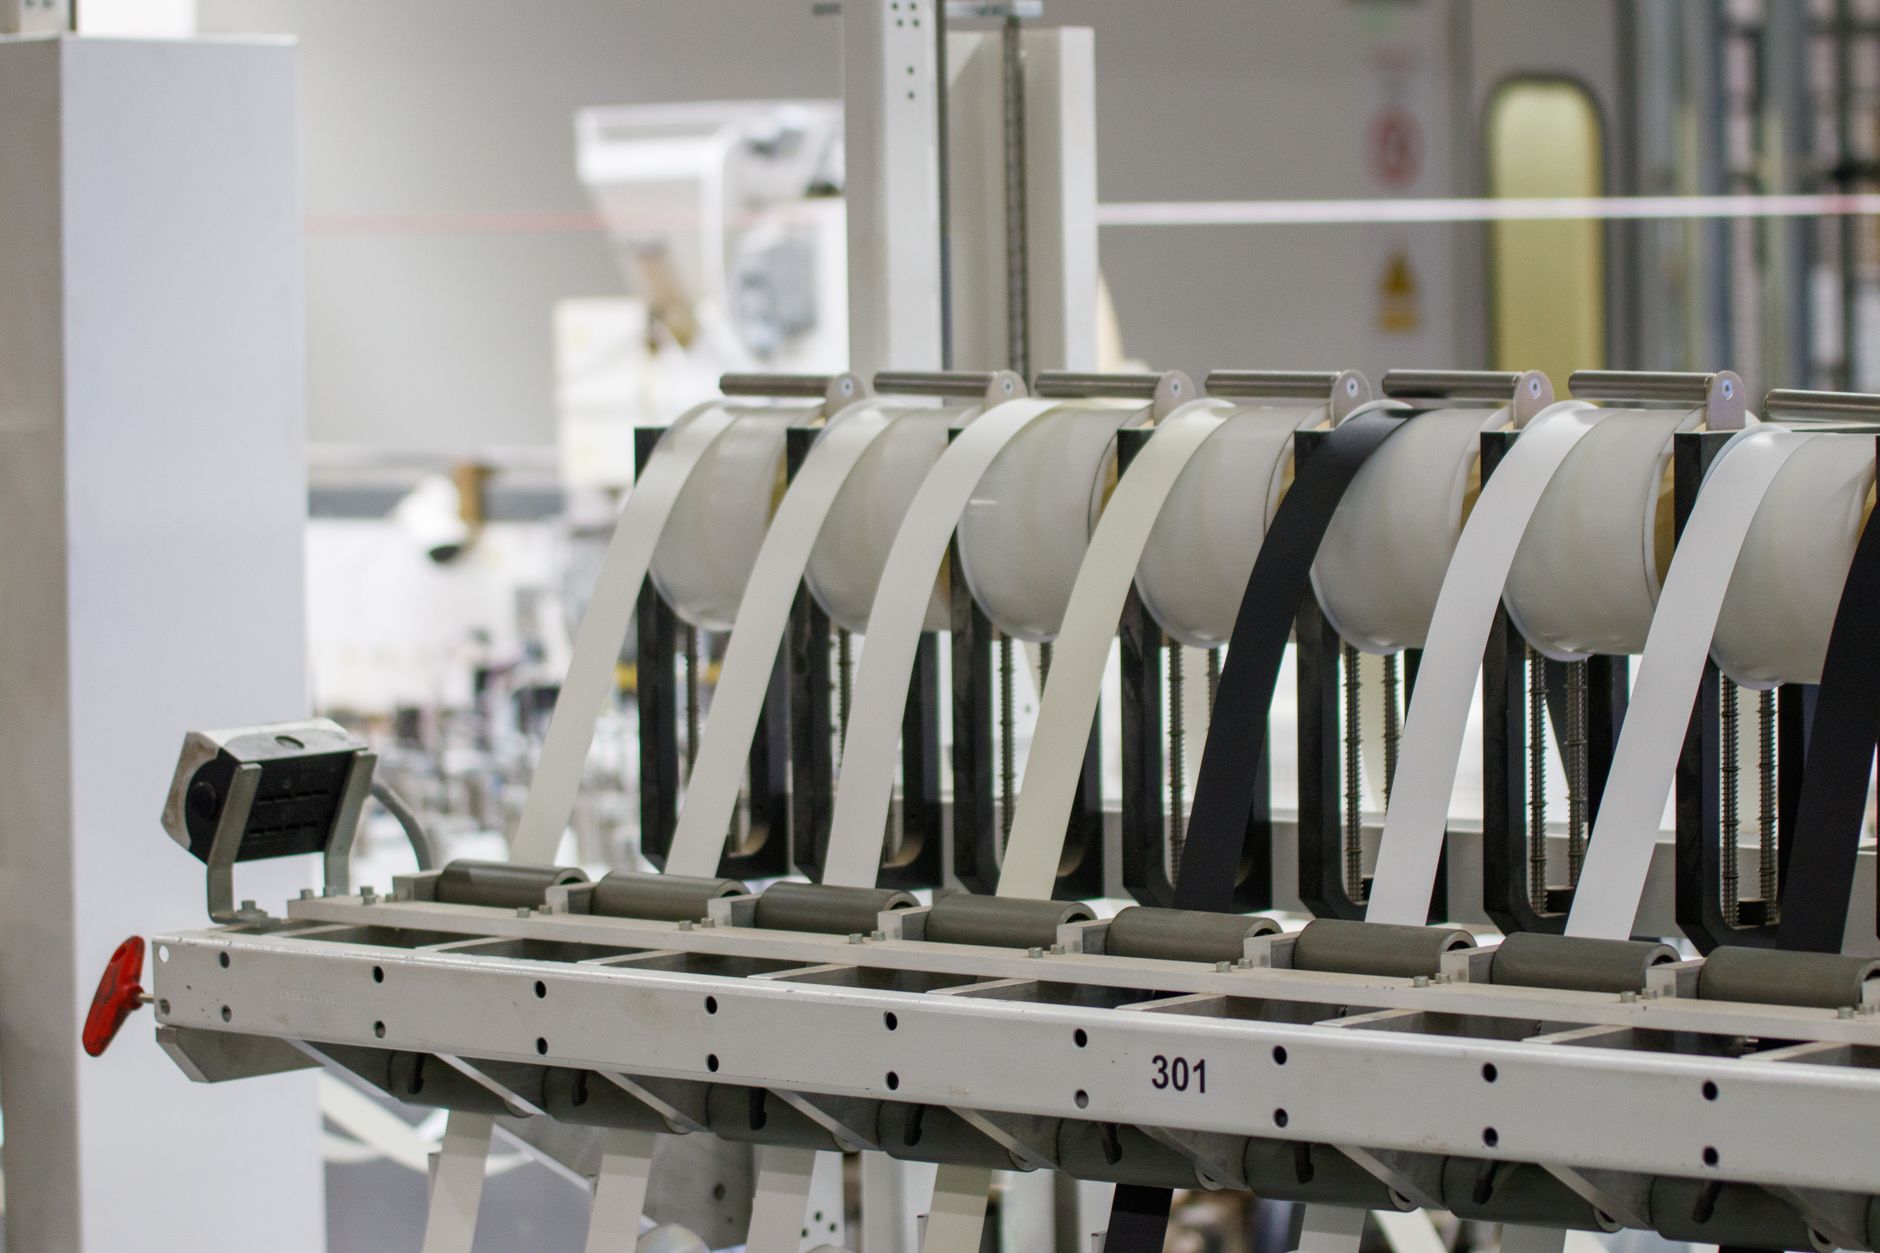
Factory order data has shown clear deceleration. New orders for manufactured durable goods have softened, with the capital goods categories – which include machinery, equipment, and fabricated metals – showing the most pronounced weakness. These are exactly the product lines that move on rail. Consumer-facing manufacturers, dealing with elevated inventory levels they built up during supply chain recovery, have also pulled back on inbound shipments. The combined effect is a broad pullback in rail traffic that cuts across carload categories rather than concentrating in one corner of the network.
Intermodal Traffic Tells a Different but Related Story
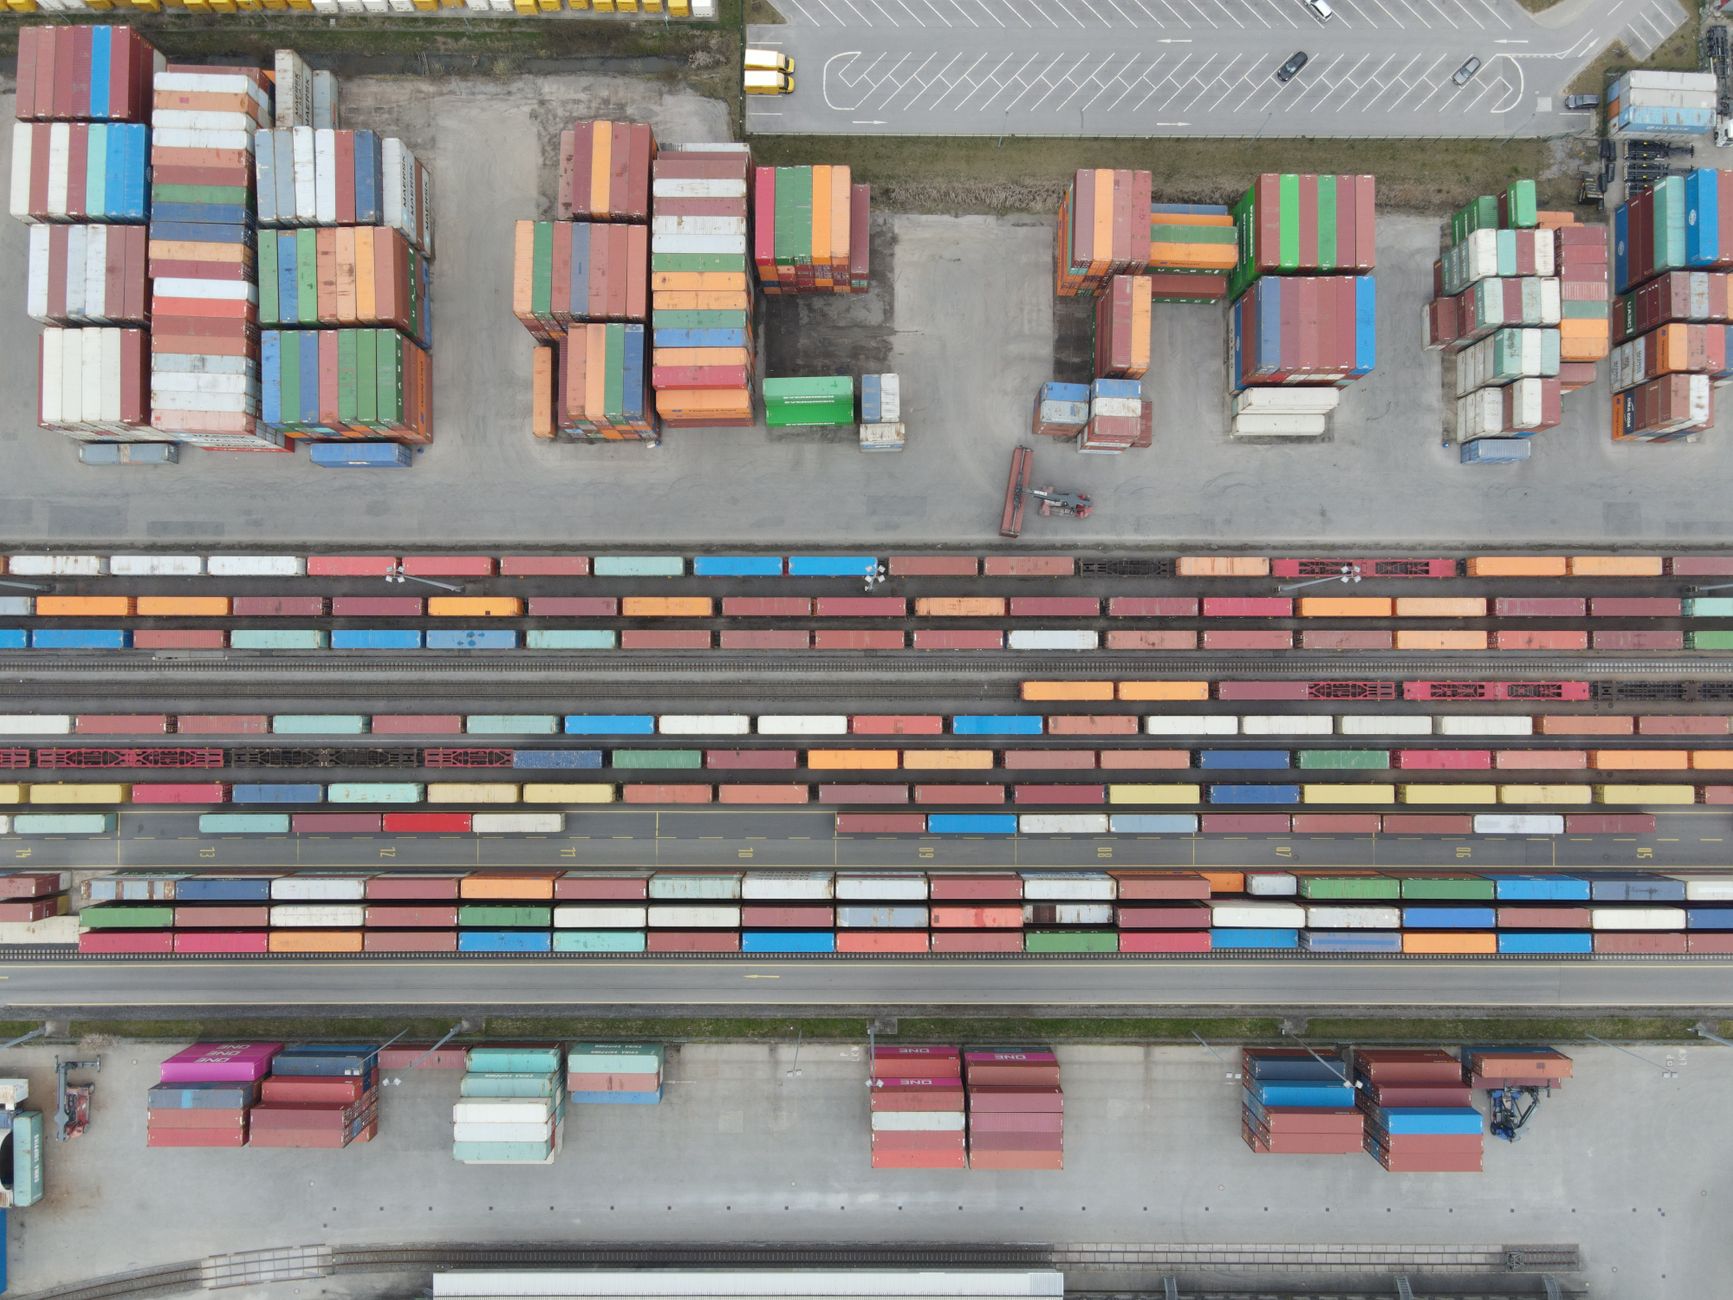
Intermodal volume – containers and trailers moved by rail, typically representing finished consumer goods and retail supply chains – has also softened, though for somewhat different reasons. Retailers who overstocked in 2022 and 2023 are still working through excess inventory in several product categories. Until those shelves clear, reorder rates stay low and container volumes on rail stay compressed. The import slowdown visible at major West Coast and Gulf ports has fed directly into weaker intermodal numbers as fewer arriving containers need inland rail movement.
The intermodal picture has been further complicated by trucking competition. Spot truck rates dropped sharply over the past year as trucking capacity remained loose, which pulled some freight that would normally move intermodally back onto the highway. Rail is typically more cost-effective for longer hauls, but when truckers are desperate for loads, they quote rates that make the math close enough that shippers choose speed and simplicity over cost. That dynamic has not fully reversed.
What makes the current intermodal situation worth watching is that it cannot be fully explained by any single factor. Inventory overhang, soft import volumes, and trucking competition are all pressing on volume simultaneously. That kind of multi-front pressure typically takes longer to resolve than a single-cause dip, which means a meaningful intermodal recovery likely depends on retail demand picking up, not just supply chain normalization.
Grain and agricultural shipments have provided some offset. Harvest volumes and export demand have supported carload numbers in those categories, which is why overall rail volume figures look somewhat less alarming than the industrial-focused breakdown. Strip out agriculture and coal – which moves on long-term utility contracts largely insulated from economic cycles – and the remaining carload picture looks considerably softer.
What the Big Railroads Are Seeing Operationally
The major Class I railroads – the large networks that carry the bulk of U.S. freight rail traffic – have responded to softer demand by pulling back on crew and locomotive deployment in some corridors. This is standard operating procedure during a volume trough: reducing active assets controls costs and protects margins during soft periods. The operational flexibility railroads developed after years of service reliability problems has made this kind of adjustment more efficient than it was a decade ago.
Pricing has held relatively firm at the contract level, since most large shippers negotiate multi-year agreements with volume commitments and rate escalators built in. Spot volumes and ad-hoc shipments are where the pricing pressure shows up first, and that segment of rail business has seen rate softness consistent with the overall volume picture. For railroads carrying heavy capital burdens – track maintenance, equipment, and right-of-way costs are largely fixed – volume is the variable that drives profitability most directly.
The Forward-Looking Question for Industrial Recovery
Rail volume acts as a preview of where manufacturing output data will land when it is officially reported. The current trajectory points toward continued softness in industrial production through the near term. A recovery in rail traffic would require new manufacturing orders to firm up, which in turn depends on whether business investment spending recovers and whether consumer demand gives manufacturers enough confidence to rebuild order books.
Interest rates remain a weight on capital spending. Equipment financing costs are high enough that manufacturers have been deferring capital projects, which suppresses demand for the exact categories of goods – machinery, industrial materials, structural steel – that generate the densest rail traffic. Until borrowing costs come down far enough to unlock deferred projects, the factories stay in a holding pattern and the rail cars sit idle.
The clearest signal to watch is the ISM Manufacturing New Orders Index. When that reading climbs back above 50 and holds there for two or three consecutive months, it typically precedes a rail volume recovery by four to eight weeks. Right now, new orders remain in contraction territory. Rail operators, shippers, and investors tracking industrial exposure are all watching the same number – and it has not yet given them anything to feel confident about.